Identifying support and resistance is the backbone to technical analysis, and it’s essential to anyone interested in using technical analysis in their trading of the best penny stocks. Fortunately, with proper guidelines and practice, it is a skill just about anyone can gain.
With that said, let’s define what we mean by support and resistance.
Definition: Support and Resistance
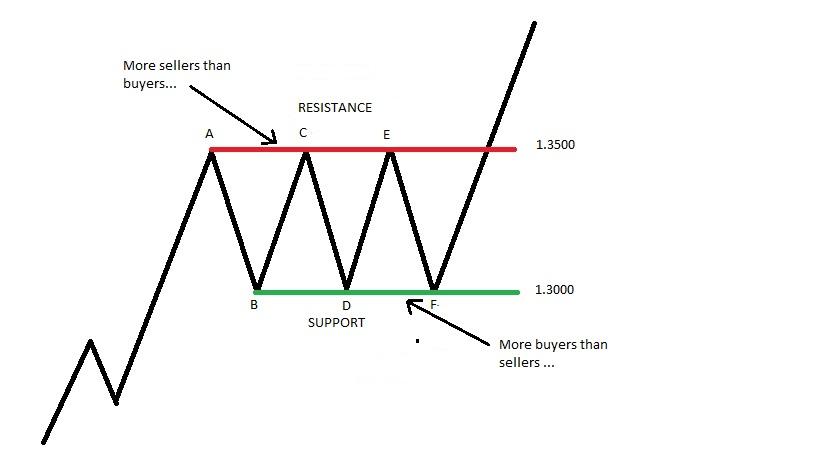
Support is defined as a price level where an asset stops declining due to the presence of more buyers than sellers. On the other hand, resistance is a price level where the asset can no longer rise because there are more sellers than buyers.
Sounds simple, right? Well, it can be. However, there are a few types of support and resistance. The simplest type is based purely on horizontal price levels, and so it is there we will begin…
Horizontal support and resistance
The following is a walk-through on how horizontal support and resistance points are identified…In the illustration below, you see that our hypothetical stock XYZ, rises up to $1.35 before forming a high (Pivot A) and then declining to $1.30, forming a low (Pivot B). Now that these high and low pivots (also known as turning points) have been established, you can use those levels as reference points for determining support and resistance and picking penny stocks.
After the decline to Pivot B, buyers stepped in causing XYZ to rise back up to $1.35, before stalling once again (Pivot C) resistance. It then jogged back down to 1.3000 before turning around (Pivot D) – support. The stock price continued to trade between these two levels before eventually breaking out above 1.35. The oscillation of the stock price between these two price levels created what we refer to as a trading range.
So how can we use this information to make better trading decisions for otc penny stocks?
Entries and exits
Well, we can use it to make entries and exits. For example, let’s say a stock has proven to have found buyers at a certain price level, one could use that level to make a long entry. On the other hand, if you were already long, you might use a beak beyond that level to be your exit.
So let’s say that we have found support at $1.30 and we wanted to risk $100 on the trade. If our entry was $1.31, we could buy upwards to 5k shares if we knew our out was going to be a breach of $1.30. You might want to buy less shares to give yourself more wiggle room. Computer trading programs are well aware of support and resistance levels, so they might push a stock price past those levels only to recapture them quickly. For example, the stock price could suddenly flush past $1.30 go to $1.20, shake out all the longs and then go back up to $1.30.
If you give yourself a small margin for error, you could end up churning your account. With that said, support and resistance still works in today’s trading. Sure, high frequency traders have made it more difficult, but by adding support and resistance to your other criteria it should make your day trading and swing trading more effective.
YOU MAY ALSO LIKE
 Breakout Penny Stocks – How To Spot Them
 Trading Sizing With Good Penny Stocks
 A Business Approach To Trading Hot Penny Stocks
 Why Paper Trading Penny Stocks Is A Good Idea
 How Much Do You Need To Get Started For Trading Good Penny Stocks
 A Simple Approach To Position Sizing and Money Management Trading Penny Stocks